We have released a brand-new Report Dashboard just in time for the 2025-2026 SY! This new feature is available to all teachers and students of all types, including public/private schools, homeschools, and individual families.
Our reporting engine only contains data for courses hosted in our system! Schools hosting our courses in Canvas, Schoology, or a similar district LMS will rely on their LMS reporting, as no data is stored in CompuScholar's system.
What's New?
 Previously, our report dashboard was powered by a 3rd-party reporting engine. While initially a good fit, this 3rd-party service grew slower and more complex over time, making it hard to find relevant information.
Our new report dashboard was developed completely in-house by the CompuScholar team with an eye towards speed and relevancy. The reports should be displayed in seconds and not minutes, and the available information now supports the insights that teachers have requested.
The new reports contain data starting in July 2025. No prior data is available.
Report Navigation
All students and teachers can click on the Report Dashboard link in their Student Menu or Teacher Menu to access the new reports.
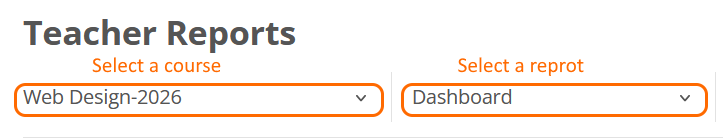
At the top of all pages, you will find two drop-down boxes that let you select a specific course or a specific report.
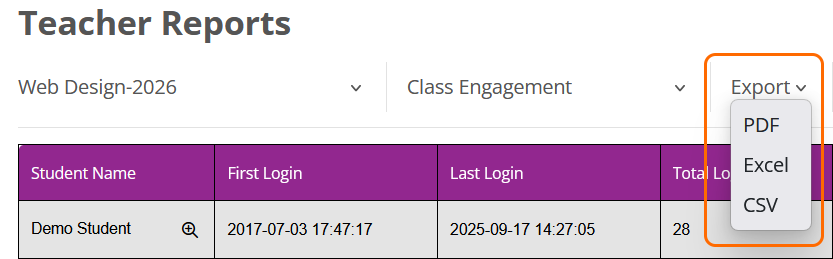
When looking at a specific report, you'll also find an "Export" tab on the navigation bar. All reports can be exported to PDF, Excel, and CSV files for your permanent records.
Now that you understand the basic navigation, let's explore the data available to teachers and students!
Teacher Reports
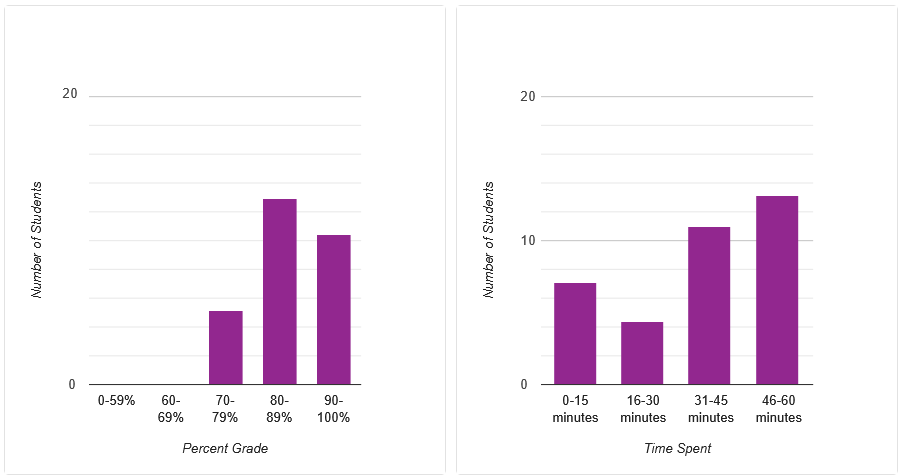
The initial Teacher Dashboard contains summary graphs showing how groups of students have scored and spent time in the system. The left bar chart shows how many overall student grades fall into the typical grade ranges (e.g., 90-100%). The right bar chart shows how many students have spent certain amounts of time within the system.
The following reports are currently available from the drop-down menu at the top of the page.
- Class Engagement - Shows how much time each student has spent overall in the course, their number of logins, and similar details
- Student Engagement - Shows how much time a specific student has spent on each of the course resources (e.g., Chapter 1, Lesson 1 Text)
- Student Grade Detail - Shows the current grade and last submission time for every gradable element in the course (Quizzes, Exams, Activities...)
- Recent Student Activity - Shows details of major actions the students have taken within the system over the last 30 days
- Content Utilization Summary - Shows a summary of how many clicks and time spent on each resource (e.g., Chapter 1, Lesson 1 Text) by all students in the class.
- Content Utilization Detail - Shows the number of clicks and time spent in a specific course resource (e.g., Chapter 1, Lesson 1 Text) by individual students
- Assessment Analysis - Shows summary information about each quiz and test, such as completion times and average grades
- Remedial Suggestions - Shows the percentage of students who got each question right or wrong on a specific assessment
These reports combine to provide powerful insights into student engagement and progress.
Student Reports
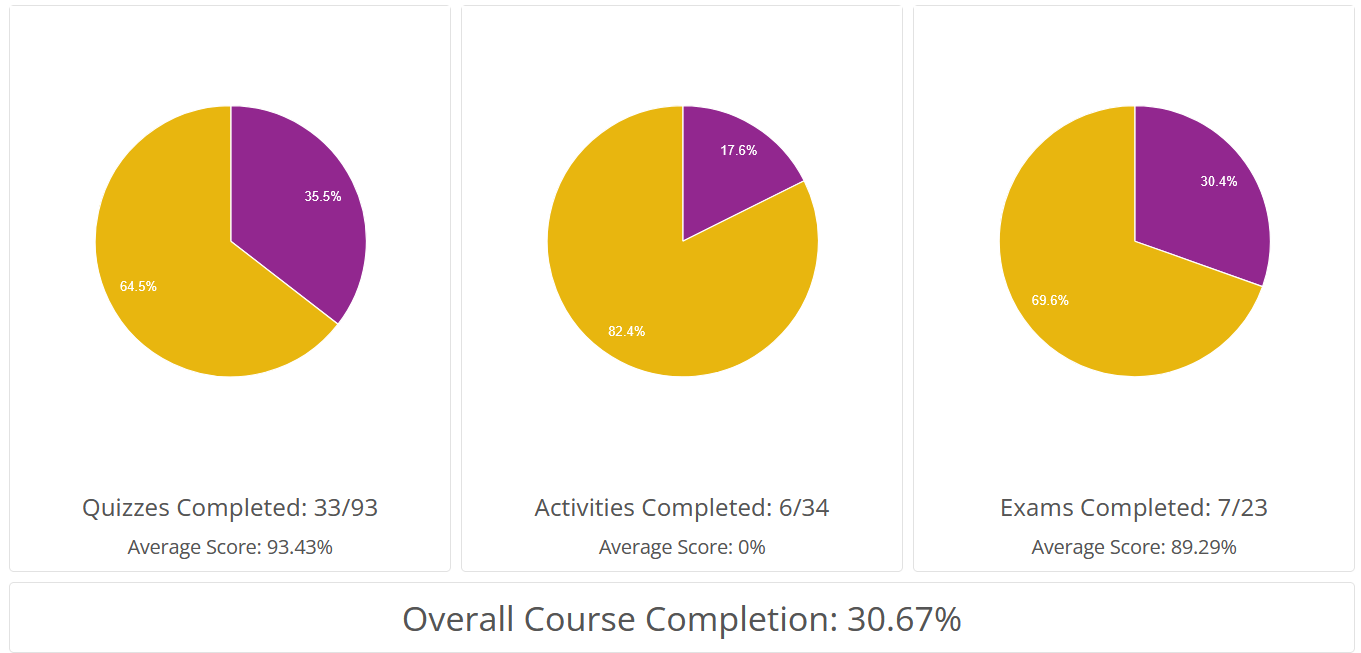
The initial Student Dashboard contains three pie charts showing their percent completion on the major categories of gradable items like Quizzes, Exams, and Activities. It also lists the overall percentage complete at the bottom.
The following reports are currently available from the drop-down menu at the top of the page.
- Student Engagement - Like the teacher report of the same name, shows how much time this student has spent on each of the course resources (e.g., Chapter 1, Lesson 1 Text)
- Recent Student Activity - Like the teacher report of the same name, shows details of major actions this student has taken within the system over the last 30 days
These reports illustrate to students how the system tracks their activities and progress.
Future Enhancements
We may add new reports over time, and we welcome your suggestions. If you have an idea for new data you'd like to see in a report, please Contact Us to start that conversation.
Similarly, we welcome all bug reports and questions about this new feature. We appreciate all opportunities to make system improvements and fixes, so don't hesitate to reach out if you spot anything odd.
For More Information
Check out our October 2025 Professional Development Webinar - "Exploring the Report Dashboard" - for further discussion and a video walk-through of the available reports. As always, please Contact Us if you have questions!